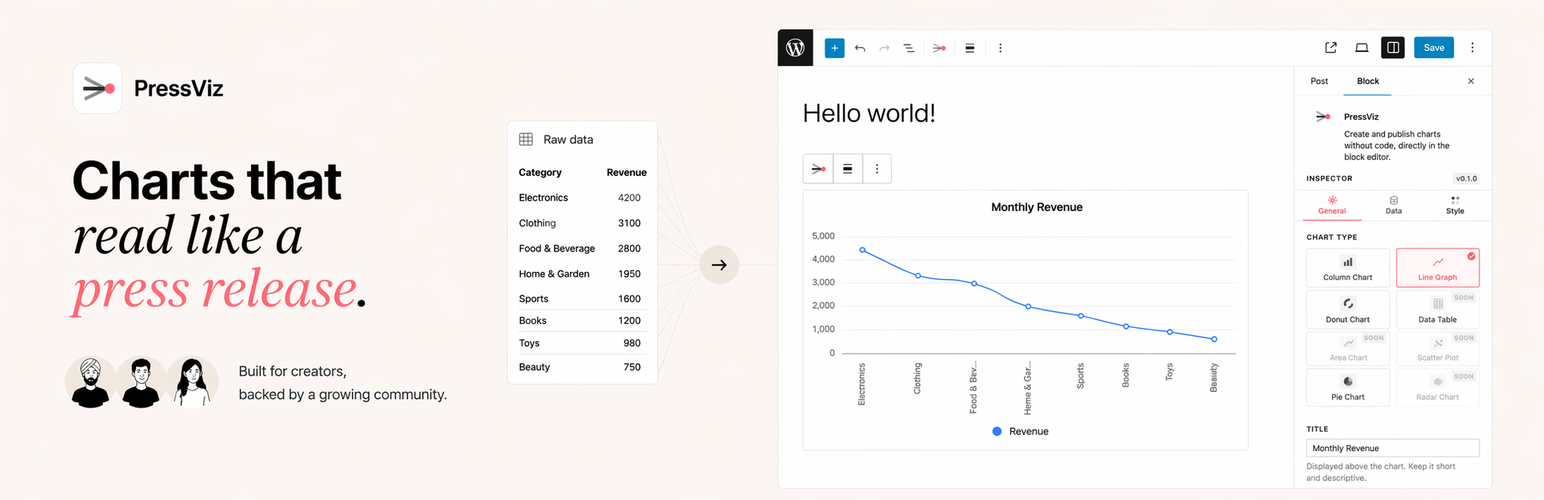
PressViz – WordPress Charts and Tables Security & Risk Analysis
wordpress.org/plugins/pressvizCreate responsive charts and tables in WordPress with a no-code block editor, CSV import, front-end export buttons, and accessible output.
Is PressViz – WordPress Charts and Tables Safe to Use in 2026?
Generally Safe
Score 100/100PressViz – WordPress Charts and Tables has no known CVEs and is actively maintained. It's a solid choice for most WordPress installations.
PressViz – WordPress Charts and Tables Security Vulnerabilities
PressViz – WordPress Charts and Tables Release Timeline
Maintenance & Trust
PressViz – WordPress Charts and Tables Maintenance & Trust
Maintenance Signals
Community Trust
PressViz – WordPress Charts and Tables Alternatives

Visualizer – Tables & Charts Manager with Built-in AI Generator
visualizer
Create responsive charts and tables manually or let the built-in AI build them from a text prompt. Supports multiple chart types and flexible data.

Chart Block – Visualize Data with Bar, Line, Pie Charts
chart-block
Represent your data by symbols, such as bars, lines, or pie charts.

Pricing Tables Block
pricing-tables-block
This plugin brings a Pricing Tables Blocks to the new WordPress Gutenberg editor.

Dynamic Tables
dynamic-table-blocks
Responsive table blocks with intuitive keyboard navigation, familiar spreadsheet-style interactions, and advanced formatting.

FRIA Single Value Chart
fria-single-value-chart
A simple plugin that displays a badge with a text and an arrow. The purpose is to display trends and business metrics on your wordpress site.
PressViz – WordPress Charts and Tables Developer Profile
1 plugin · 0 total installs